Process Mining KPI Dashboard
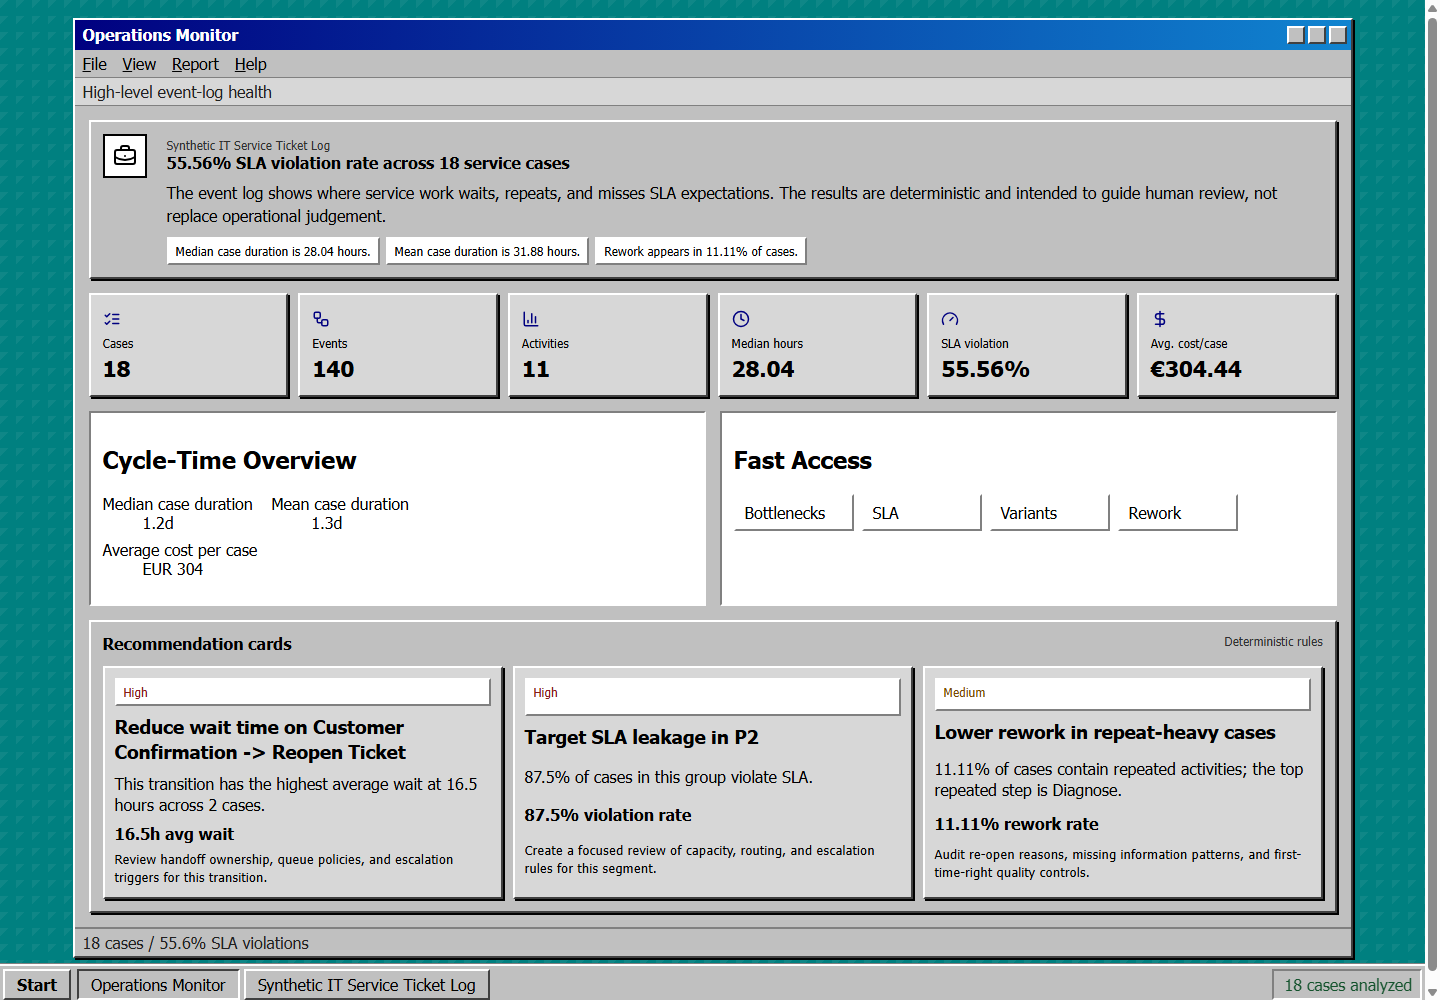
Local process-mining dashboard for IT service ticket event logs, covering SLA monitoring, bottleneck detection, variant analysis and executive reporting.
- Stack
- TypeScriptReactProcess MiningEvent Logs
Problem
Service desk event logs record what actually happened to every ticket, but the raw log answers none of the questions an operations manager asks: where work stalls, which paths cases really take, and where the service level agreement is being missed.
Approach
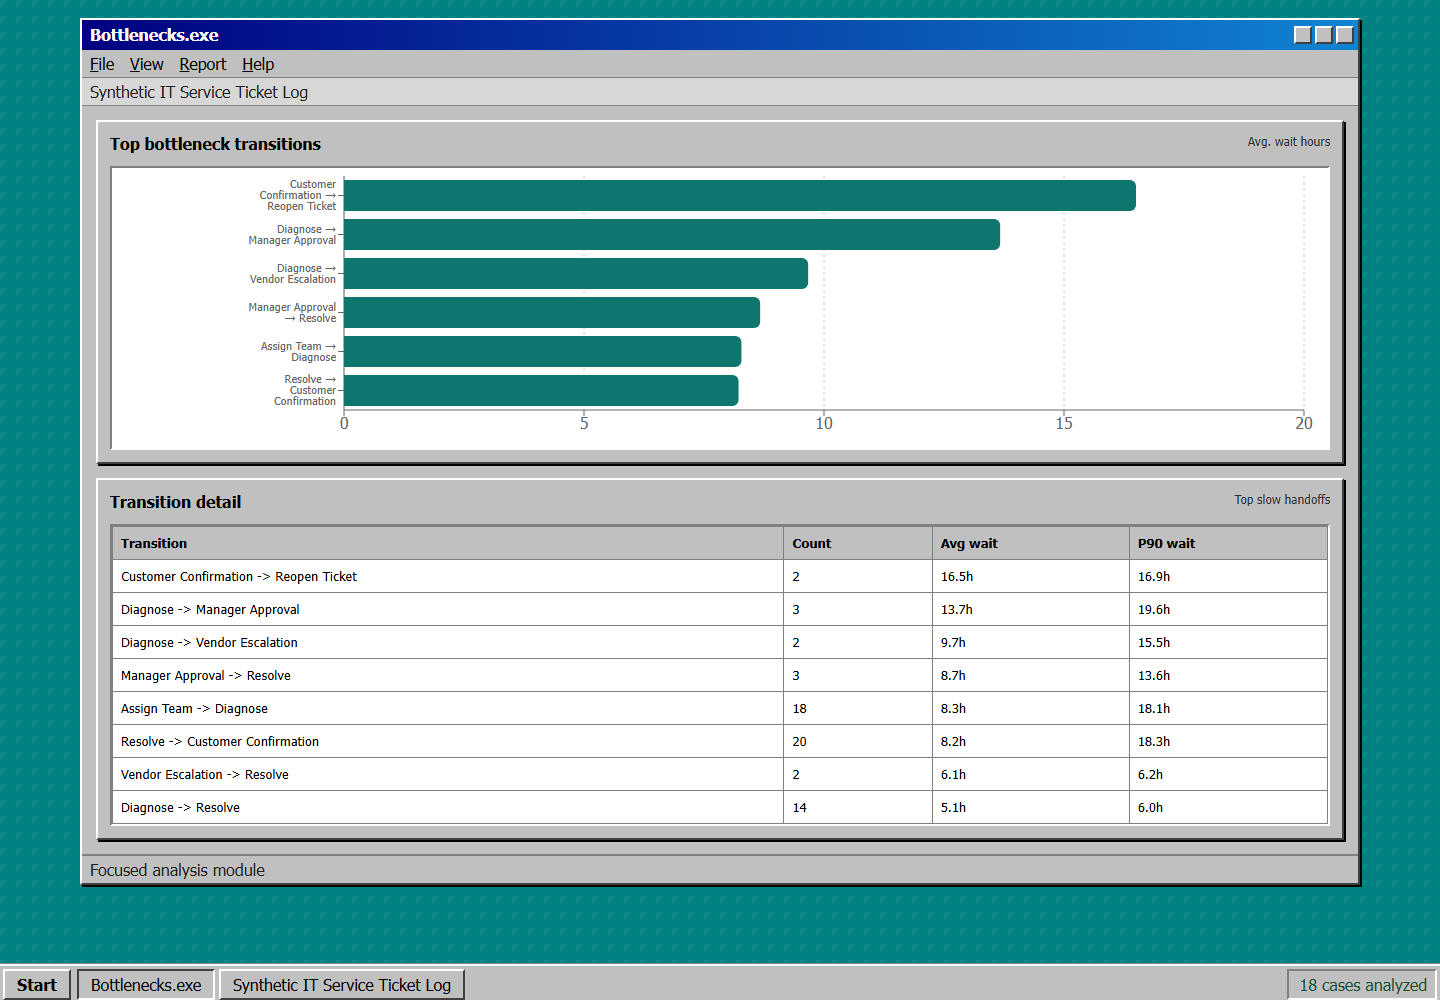
The project reads an IT service ticket event log and derives the standard process-mining views over it: throughput and case volume, SLA compliance, bottleneck ranking by waiting time, process variant analysis, and rework detection. It runs locally against a supplied log rather than depending on a hosted platform.
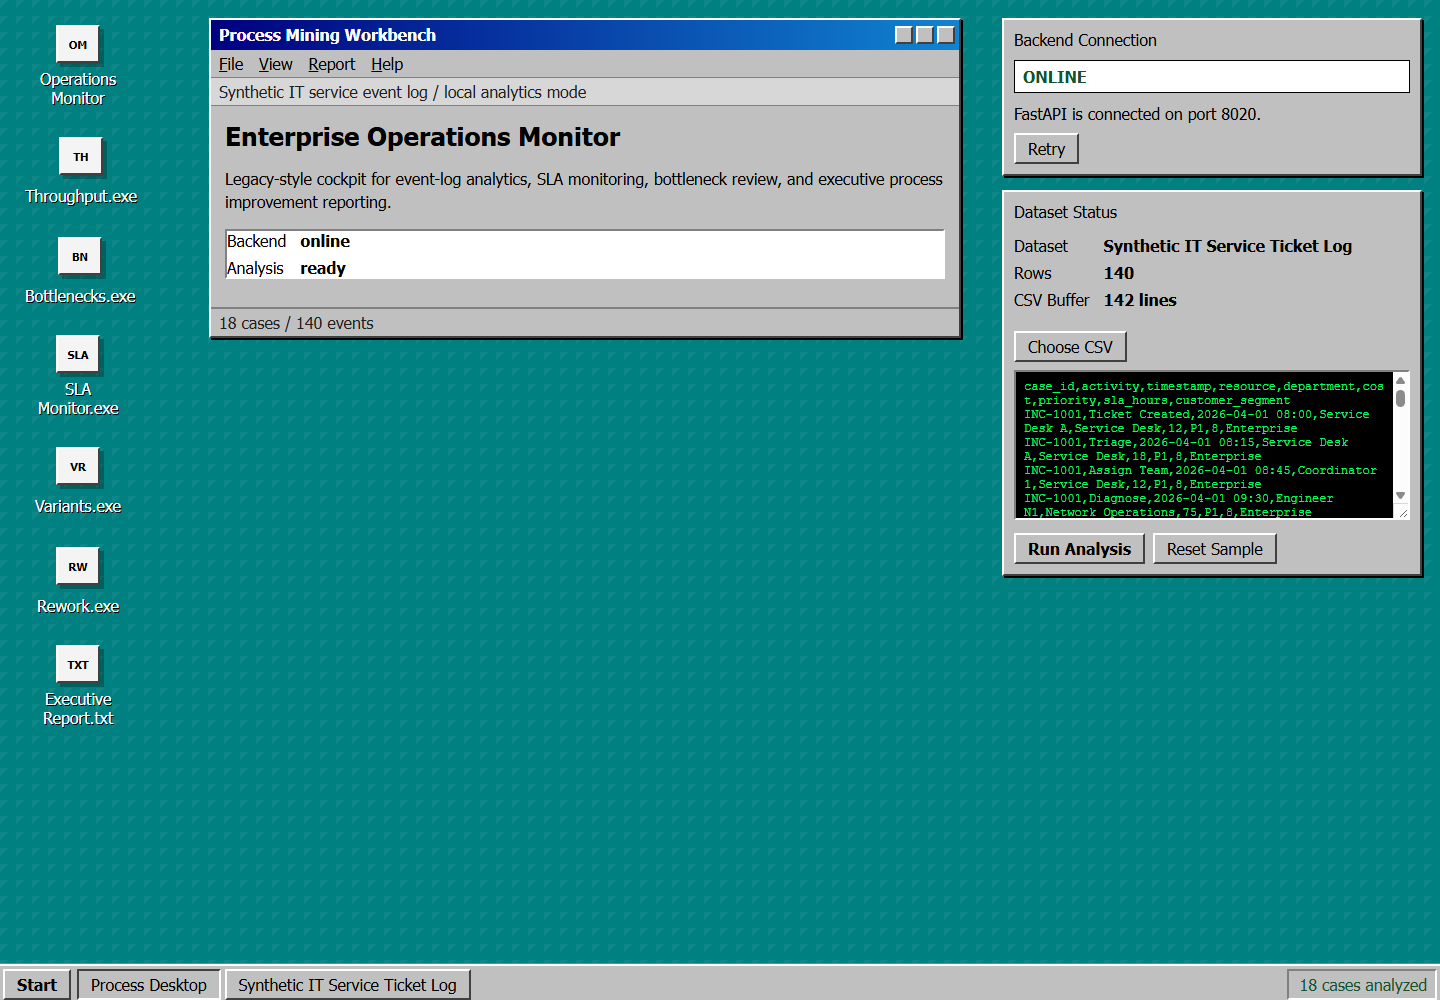
The interface is deliberately styled as a retro Windows desktop, with each analysis in its own window, so several views can be read side by side rather than through one dashboard at a time.